by Martin Laukkanen | Jan 12, 2011 | Reporting, SharePoint 2010, Troubleshooting
Update 21/01/2011: Update below regarding Excel Services and Multi-tenancy!
One of the exciting new features of SharePoint 2010 is multi-tenancy, if you’re working in hosted or shared environments then it is no less than a must-have feature.
Unfortunately in the real world of software nothing is perfect at RTM, and this would have to be one of those cases!
In short neither Project Server or PerformancePoint appear to support multi-tenancy in SharePoint 2010, it would seem that the feature has yet to be fully implemented for either service application, however the situation is not as bad as you might fear.
Project Server in a multi-tenanted environment
Firstly although Project Server does not accept any subscription related parameters when provisioning a new instance using PowerShell or the Central Admin, it does appear to work in a tenanted environment. Basically the fact that any provisioned PWA site is a site collection of its own means that once you have provisioned your PWA instance you can use the following PowerShell command to associate your PWA site collection with your tenant subscription:
Set-SpSite $PWASiteUrl -SiteSubscription $subscription
More good news is that once provisioned a PWA instance is able to communicate with other service applications belonging to the same subscription. Most importantly: Secure Store Service. Without that Excel Services wouldn’t work!
All is not good though, especially if you like to use the full feature set of the 2010 product, read on..
PerformancePoint in a multi-tenanted environment
This is where the news gets bad, it would appear that PerformancePoint in 2010 does not support multi-tenancy at all, it actually doesn’t appear to respect tenant subscriptions and so as a result you might end up with errors like the following when attempting to run Dashboard Designer or configuring the service application unattended account;
w3wp.exe (0x04E4) 0x0ED8 Secure Store Service Secure Store 7557 Critical The Secure Store Service application Secure Store Service Proxy is not accessible. The full exception text is: Access is denied. adfdd2a3-b6e5-4d92-8c5e-5a44fd821969
w3wp.exe (0x04E4) 0x0ED8 Secure Store Service Secure Store d9ld Unexpected Unexpected exception from endpoint address
w3wp.exe (0x04E4) 0x0ED8 Secure Store Service Secure Store d9le Unexpected Logging unknown/unexpected client side exception: SecurityAccessDeniedException. This will cause this application server to be removed from the load balancer queue. Exception: System.ServiceModel.Security.SecurityAccessDeniedException: Access is denied
Some searching will lead you to a number of sources talking about the lack of a Master Key being created in the Secure Store which is most certainly the cause of the issue, unfortunately it appears that in the case where your Secure Store is created with tenancy enabled PerformancePoint is unable to see the Secure Store service application (and thus unable to retrieve the master key)!
Some deep reading led me to some TechNet articles detailing the requirements for PerformancePoint (sorry can’t find the link ATM), basically PPS requires that a Secure Store Service Application exists in the default proxy group, and as I’ve found that app also cannot be tenanted.
Fortunately this can also be worked around, maintaining a non-tenanted default Secure Store app dedicated to PPS does not as I see it introduce any security implications, in particular as you will have to provision a separate PPS service for each tenant in your farm (thus losing much of the benefits of multi-tenancy).
All I can say on this one is that I can’t wait for SP1 for PPS, maybe then we’ll even be able to name our databases and lose that BETA PowerShell command line syntax? :)
Update 21/01/2011:
See the following blog for information on how Excel Services impacts the above configurations!
by Martin Laukkanen | Sep 1, 2010 | Reporting, Troubleshooting
I came across this little annoying issue while creating some linked PPS dashboards where one scorecard item would filter another report by the selected row (in this case a ‘Program Name’ custom field). I was stumped to get the following message when selecting my program:
Error running data source query
After much head scratching I found the problem deep in the logs which for Google’s benefit I will include some server log snippets here:
Log Name: Application
Source: Microsoft-SharePoint Products-PerformancePoint Service
…
Description:
An exception occurred while running a report. The following details may help you to diagnose the problem:
Error Message: Error running data source query.
<br>
<br>
Contact the administrator for more details.
Dashboard Name:
Dashboard Item name:
…
Parameters: Programme A
Exception Message: Error running data source query.
And
PerformancePoint Services error code 10116.
…
<Data Name="string1">Error running data source query.
Microsoft.AnalysisServices.AdomdClient.AdomdErrorResponseException: Query (10, 19) Parser: The syntax for ‘A’ is incorrect.
The problem turned out to be a space in my custom field value name!
Basically the hint was in the Parameter and the syntax, it seems that PerformancePoint fails to send my parameter correctly and as a result it sends ‘Programme A’ as two separate invalid parameters ‘Programme’ and ‘A’, hence the error on “The syntax for ‘A’ is incorrect”.
This was quickly proved by updated the custom field lookup table values to remove any spaces, which after a cube rebuild resolved the error!
Definitely chalk that one down to a little defect hidden in the code somewhere!
by Martin Laukkanen | Aug 7, 2010 | How to, Project 2010, Reporting
One of the biggest areas of advancement in Project Server 2010 is reporting, with Project now utilising; Excel Services, SQL Analysis Services, SQL Reporting Services and PerformancePoint the options are almost endless.
However most people I encounter look at that list and say; “What on earth is PerformancePoint?”, so lately I had another opportunity to flex my PPS skills and thought I might share my experience to give you a taste of how powerful yet simple to use this new thing can be.
Creating a Dynamic Resource Utilisation Graph using PerformancePoint
I’m going to keep this very simple, as I find PPS to be very often quite mind-boggling, so to give you a taste of it what I’ll describe here is how to create a simple equivalent to the old typical Data Analysis Resource Utilisation view.
So before you begin, make sure you have your Cube setup and built, the PerformancePoint service application setup and running in your SharePoint installation and some data to play with.
First step you need to get to the PerformancePoint Dashboard Designer, this is a nifty little web application (independent from the Office Web Apps) that is automatically installed and made available when you provision a PWA site.
To find it, open up the Business Intelligence site, and from there the quickest way to get to it is by hovering over any of the landing page images (Create Dashboards, etc) and selecting the ‘Start using PerformancePoint Services’ link.

You then have the icon to run Dashboard Designer:

This should download and install the designer for you, and assuming that you have all the correct permissions (and that PWA is in your Internet Explorer trusted sites), you will end up with a mostly empty designer window looking something like the image below.
Now you’re ready to start creating those reports, first step setup your Data Connections by selecting the Create tab on the ribbon and selecting Data Source:

Select Analysis Services as the connection type, and populate the connection details and properties as required:

For Analysis Services datasources you should populate the Time tab to ensure that your Time dimensions are correct, something like this;

Finally when you are done, select save from above the ribbon to continue.
Note: This is something you will get used to with the Dashboard Designer, everything is automatically saved to the PWA BI site in their respective locations (dataconnections, reports or dashboards), with just one exception being the ‘Workspace’ which is effectively your configuration of Dashboard Designer (something I don’t usually bother saving).
Now lets move on and create our report, select PerformancePoint Content and then from the Create ribbon lets select ‘Analytic Chart’;

Then select your datasource just created and hit finish, then your report will open in the designer;

Give it a name and then lets start adding content:
- First add some measures to the Series; Work and Actual Work.
- Now add your Resource List dimension to the Bottom Axis.
It should look something like this;

If you want to expand members of a dimension select the chevron (Down arrow next to the X), and select the members in the dialog.

Here for dynamic dimensions like the Resource list you are better off right-clicking and selecting one of the Autoselect Members, such as All Children, like so;

Which now looks like:

Finally we need our Time dimension, add it to the Bottom Axis from the right list and use the chevron to select the desired time periods (I’m selecting months by name here, however you can use something called Named Set’s to do this dynamically for you – another blog article maybe). Finally I think it’s best to move the Resource List to the top of the series Series list and apply some filters to filter out the blanks, to give us something like:

Don’t forget the Edit tab on the Ribbon which has a number of settings that you’ll find handy getting your report right.
Almost there now..
Okay so now we’re ready to save and see this thing for real, so hit the save button, and lets minimise the designer and go back to our BI site in Internet Explorer.
If you open the default ‘PerformancePoint Content’ link, you should see your new report listed, select the drop-down to Display the report:

Final product:

Now this report is ready to add to any where in SharePoint using the PerformancePoint viewer web part, and the best thing is that all of the dynamic functions will be available to all users, so if someone wants to view this report in terms of Cost / Actual Cost, it’s just a few clicks away:

Or maybe you want to see the breakdown of a particular person’s activities using the Decomposition Tree?

I’d say this beats those old Data Analysis views!
That’s it for this how-to, hopefully this scratching of the surface has shown you some of the potential of PPS, keep experimenting and you’ll see very quickly how easy it is to replace those old Data Analysis views that are so 1990!
In the future I might come back and write a Part II to this one on creating your first KPI Scorecard in PPS, stay tuned..
by Martin Laukkanen | Apr 22, 2010 | How to, Project 2010, Reporting
As you’ll quickly find in Project Server 2010, if you want to use the default Business Intelligence Center data connections then in order to include your own custom fields, then you’ll need to update the connectors. Here’s a quick guide on doing that to get to that data for your first Project Status Report.
Before I get into it don’t forget that the OLAP connections are automatically created, so in many cases you can use those, but if you’re like me and prefer direct reporting from the Reporting Database then you’ll have to create your own connections.
Step 1: Start from an existing connection file
For this I am going to use "Project Server – Project and Task Data" from the default location "BC CenterData Connections – English (…)", find the existing file and save it somewhere locally using the Send to – Download a Copy option.

Now open that ODC file in Notepad and you’ll see the XML contents and hopefully the important part the section labelled <odc:CommandText> where the SQL "SELECT …" statement is, that’s what we need to change to include our custom fields.
Step 2: Add your Custom Field details using SQL Management Studio
Using SQL Management Studio is the easiest way to confirm that you have the right field names to add to the query, to do that find your ProjectServer_Reporting database and in particular what you will want is the View named dbo.MSP_EpmProject_UserView (or one of the others if you want task or resource fields). Select the view and using the ‘Select Top 1000 Rows’ option to generate a SELECT query returning all data.

You’ll end up with something like this:
/****** Script for SelectTopNRows command from SSMS ******/
SELECT TOP 1000 [ProjectUID]
,[ProjectName]
[ …. Snip lots of built in fields….]
,[ProjectBaseline10Duration]
,[Project Departments]
,[Sample Business Need]
,[Sample Areas Impacted]
,[Sample Proposal Cost]
,[Sample Compliance Proposal]
,[Sample Assumptions]
,[Sample Goals]
,[Sample Post Implementation Review Date]
,[Sample Post Implementation Review Notes]
,[Sample Proposed Start Date]
,[Sample Proposed Finish Date]
,[Sample Approved Start Date]
,[Sample Approved Finish Date]
FROM [PWA_ProjectServer_Reporting].[dbo].[MSP_EpmProject_UserView]
The nice thing is in the views all the custom fields are listed last, as you can see from above the out of the box ‘Sample’ fields are all there to see. So next you just have to copy those field names into the ODC file opened earlier and save your changes.
Step 3: Update the ODC file
The only catch with updating the ODC file as you probably noticed is the format includes the view or table name prefix, such as:
MSP_EpmProject_UserView.ProjectBaseline10FinishDate as [ProjectBaseline10FinishDate], MSP_EpmProject_UserView.ProjectBaseline10Duration as [ProjectBaseline10Duration],
So all you need to know is that unless your changing the name you don’t need the bit after ‘as’, so if you search and replace to prefix each of your custom fields to add the "MSP_EpmProject_UserView." before the "," so you end up with something like:
,MSP_EpmProject_UserView.[Sample Business Need] ,MSP_EpmProject_UserView.[Sample Areas Impacted] ,MSP_EpmProject_UserView.[Sample Proposal Cost]
Now the last step is to paste those lines into the ODC file in Notepad, but note that the commas are at the start not the end, so you just need to make sure that when you paste the new lines that you have just one comma between each line except for the last line before the "FROM". You should end up with something like this:
MSP_EpmTask_UserView.TaskBaseline10Duration as [TaskBaseline10Duration], MSP_EpmTask_UserView.TaskBaseline10DurationString as [TaskBaseline10DurationString], MSP_EpmTask_UserView.[Health] as [Health] ,MSP_EpmProject_UserView.[Sample Business Need] ,MSP_EpmProject_UserView.[Sample Areas Impacted] ,MSP_EpmProject_UserView.[Sample Proposal Cost] FROM dbo.MSP_EpmProject_UserView INNER JOIN dbo.MSP_EpmTask_UserView ON MSP_EpmProject_UserView.ProjectUID = MSP_EpmTask_UserView.ProjectUID ORDER BY MSP_EpmProject_UserView.ProjectName, MSP_EpmTask_UserView.TaskIndex, MSP_EpmTask_UserView.TaskName </odc:CommandText>
Step 4: Upload the new ODC file to your Data Connection library
Now your just about done, save the file and back in your BI Center upload the file to a new location, make sure that you don’t try to overwrite the default file as those may be replaced by future service packs, I upload them directly into the Data Connections library.
Once uploaded you can now use them in Excel as normal. You might want to update or copy the existing templates and edit the data connection properties to point to this new ODC file, or otherwise just add them in as you normally would and carry on..
by Martin Laukkanen | Feb 11, 2010 | Project 2010, Project Pro 2010, Reporting, SharePoint 2010
Just finished up at the Microsoft Project 2010 Ignite conference in Sydney and wanted to share some of the great things I learnt over the week. The sessions were very good over all I must say and it was good to meet many of the familiar names in both the .AU EPM field but also the Redmond guys who came down.
I’ll post here all my notes taken, basically covering significant items that I learnt and some questions asked and / or answered. Note though that this list is in way a complete list of content covered as basically all the hundreds of things that I have previously learnt over the past few months beta testing are not mentioned in these notes! Also the order is as it was discussed so mostly relates to the agenda, but of course some questions or items discussed were of course off topic.
Day 1
Points of Interest:
- Release date for General Availability of Office 2010 scheduled for June!
- Project Server 2010 requires SharePoint 2010 Enterprise version as a minimum.
- 2007 PWA CAL will upgrade to a full PWA 2010 AND SharePoint Enterprise 2010 CAL if on Software Assurance.
- Portfolio Server CAL’s upgrade to full Project Server 2010 CAL’s with SA.
- Full pricing is to be released very soon, and is apparently very similar to the current pricing.
- Project Pro 2010 is not backwards compatible, ie it cannot connect to PS2007.
- Synch to SharePoint lists requires only Project Pro (not Standard) 2010 and SharePoint Foundation 2010 (WSS4)
- Synch to SharePoint task function is fully disabled when connected to a Project Server (interesting).
- PWA requires Internet Explorer 7 as a minimum, and does not support Tier 2 (other modern) browsers unlike SharePoint
- Team Foundation Server 2010 for Application Lifecycle Management supported out of the box with a connector, however so far only a client based sync connector is released, the server to server connector will be released soon. Also no support for any previous versions.
- Project Web App views published data, e.g. Project Centre, but editing a project opens the working or draft copy. (Something to watch out for)
- MPP format has changed again with PPRO2010 and is not backwards compatible unless the option is specifically selected on save.
Questions asked or answered:
- Office version required for PS2010 is mainly revolving around Excel Services 2010 which requires Excel 2007/2010 for editing. However no Office version is required for just viewing reports, etc. (Not sure what Word requirements there are for editing / saving, assume the same as 2007)
- Migration / import from other data sources such as Primavera is not considered. (Not really surprising)
New Buzzwords:
- Demand Management (my favourite new topic!)
- Top Down Portfolio Management (included in PS now with PPS)
- Project Lifecycle Management – preferred to Demand Management as is more accurate to describe the workflow features.
Day 2
Points of Interest:
Things to read:
- Power Pivot! (Awesome name!)
- Eigen Vector (which is the formula behind the Portfolio optimiser percentages)
Day 3
Points of Interest:
- Must check out the BI content on the Project Programmability blog.
- Visio Services is great for dynamic data driven charts and diagrams, however it does not accept parameters (like Excel Services) which may limit some uses (such as in a project workspace template).
- Hosted option “Project Online” to be announced soon, which will comprise of a slightly cut down EPM solution for entry level clients.
- Still not possible to set a baseline using PSI.
- Delegation feature is basically equivalent to giving someone your password.
- However delegation is only valid in PWA or with Project web parts, and not in SharePoint including workspaces, or in Project Pro.
- AD synchronisation and WSS permissions sync have been ‘greatly improved’ to prevent dead-locks, etc.
- New option for Project Managers via PWA is the ‘project permissions’ option which allows project level security permissions to be assigned by the project owner, negating the need for the use of delegates for project access. (Love it, more user self service!)
- Project Pro no longer provides the password prompt option, however as it uses Claims based authentication it relies on IE settings and so if IE prompts for password then so does Project Pro.
- Now need to always think of Project Server as having 5 databases, as the SharePoint content database stores so much important data such as BI, workflow, PDP’s etc.
- Bulk Update option in Server Settings provides WSSRelinker tool functionality.
- Playbooks upgrade for 2010 to be released near release date.
- Playbooks has been fixed to not rely on GUID’s and instead use names to prevent migration issues.
- A new tool is to be released to migrate PDP’s and workflow like Playbooks.
- WSS_Logging database is a new SharePoint 2010 feature and provides fully documented performance / issue logging for the farm.
- The SharePoint Developer Dashboard feature provides very detailed page stats once enabled, detailing things like load times per web parts, SQL stored procedures called, etc.
- SQL database mirroring is now also supported in 2010.
- Manually scheduled tasks still have the old duration, start and finish stored as “Scheduled Start, etc”.
- RDB stores the scheduled start / finish etc as the normal date field, and stores the new manual values separately, and also contains a task field indicating if the task is auto / manual.
by Martin Laukkanen | Feb 8, 2010 | How to, Project 2007, Reporting
Update 31/03/2011: See the following blog about how much simpler this is with SQL Server 2008 R2.
This is one of the most common gripes that I hear about Project Server’s reporting database, the fact that only the default fields in your Project workspace lists, ie Project Risks, Project Issues, etc are available to report on.
Unfortunately I have yet to come across a client who uses (for example) a percentage probability of risk, I’m guessing it’s all that PRINCE2 influence. So as a result you are usually left with two options;
- Update the default fields to match your requirements, which actually is possible in 90% of the cases with some careful modifications to the workspace template and possibly some custom MDX measures for your cube. The biggest drawback with this one is if you want to report on new lists, such as for example a Change Register it is simply not possible without extending the RDB and cube!
-
Secondly you could find and purchase a third-party product that will allow you to report directly on all of the list contents of your workpace, some of these link directly into the sites, others use a staging database.
There is of course a third option though, do it yourself, and that is what this blog post is about.
How to access the SharePoint data?
The first question is how, and of course I should be clear as a one-time minion of the capital MS, the question must be how to do it in a supported manner. So that completely rules out direct SQL access to the databases!
Fortunately there is another way: XML.
Let me start by saying that there is a lot of information is out there on this method, so here are some links to some of the most helpful pages; at codeproject, and other blogs here and here. (That last Blog one I probably found most useful!)
Before I get into it it’s worth mentioning that my example involves using Visual Studio 2008 with the SQL Business Intelligence Design Studio (BIDS) installed. Don’t let the VS2008 bit scare you it would be possible to do much of this using Report Builder, at least once you have your data connections created, perhaps I’ll leave that for a future blog?
In summary this is what you need to do:
- Create a SRS data source pointing to your PWA Reporting database.
- Use the above data source to identify the field named "ProjectWorkspaceInternalHRef" from the "MSP_EpmProject_UserView" table for each project you want to report on.
- Then use the URL indentified to dynamically construct your XML data source query by basically appending "/vti_bin/lists.asmx" to the end of the string.
- Finally using XML pull down the information that you want.
Too easy!
Okay show me the details!
Okay so first thing you need to do after firing up Visual Studio is start a new blank Report Server Project, then:
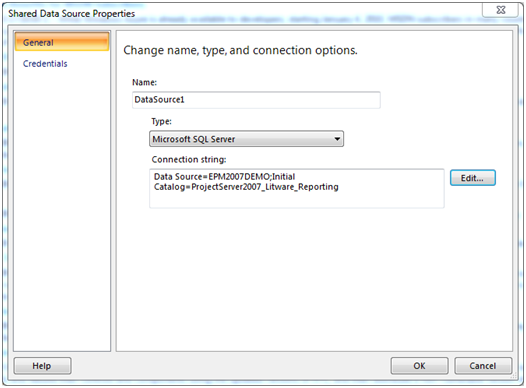
Step 1: Create your Shared Data Source
Create a standard SQL data source pointing to your Project Server Reporting database, such as:
| Data Source=EPM2007DEMO;Initial Catalog=ProjectServer2007_Litware_Reporting |
Step 2: Enumerate Workspace URLs and Select your Project
Firstly create a blank report with a simple SQL query to enumerate a list of all projects and their associated workspace URL:
Example query:
SELECT ProjectName, ProjectWorkspaceInternalHRef
FROM MSP_EpmProject_UserView
|
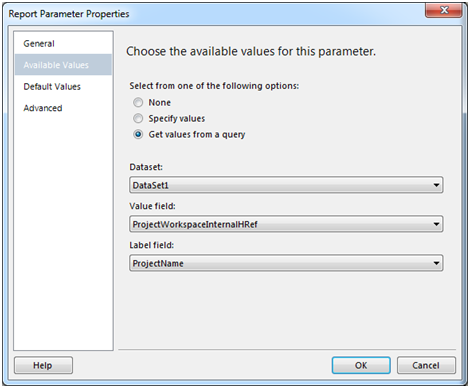
Then create a Parameter to prompt the user for a selection:
Name: SelectedProject
Prompt: Select Project
Select Get values from a query for Available Values:
Value field: ProjectWorkspaceInternalHRef
Label field: ProjectName
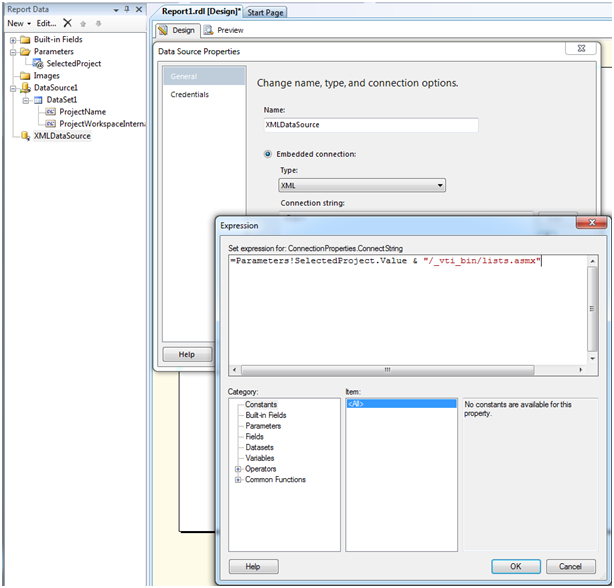
Step 3: Create your XML Data Source
Now the interesting bit, create a new non-shared datasource (Embedded connection).
Type: XML
Connection String: Expression
Credentials: Do not use credentials
Expression should be as follows:
| =Parameters!SelectedProject.Value & "/_vti_bin/lists.asmx" |
Step 4: Now create your Dataset using XML
Now you need to create your first Dataset in this XML data source, this is where we reference the actual list item, in this example Project Risks.
Create a new dataset using the following query:
<Query>
<Method Namespace="http://schemas.microsoft.com/sharepoint/soap/" Name="GetListItems"/>
<SoapAction>http://schemas.microsoft.com/sharepoint/soap/GetListItems</SoapAction>
</Query>
|
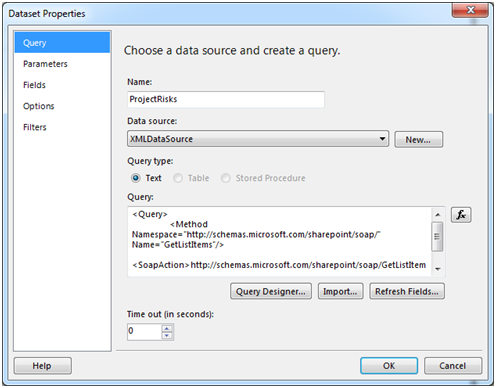
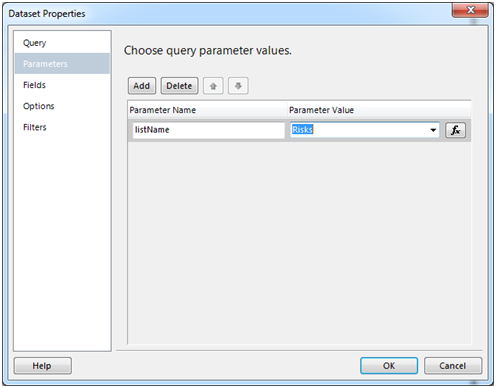
Populate the Parameters with the "listName" (note: this is case sensitive) parameter with the value "Risks":
Step 5: Select your Fields to include in the report
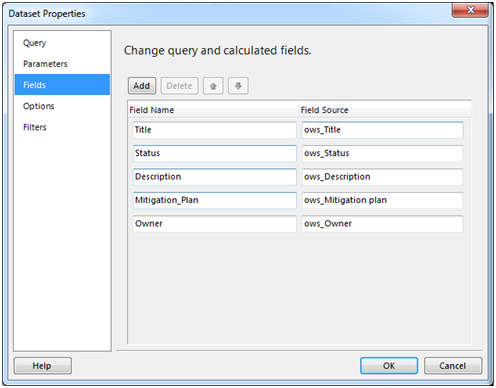
Now the annoying bit, under Fields you must include each field that you want to include in your report, however because we are dynamically generating the data source we cannot automatically populate this.
Note: To automatically populate this list hard code the data source to an actual workspace site then when you create the query for this dataset select Refresh Fields.
Otherwise you can manually populate these, just open the list in question in a workspace and open list settings:
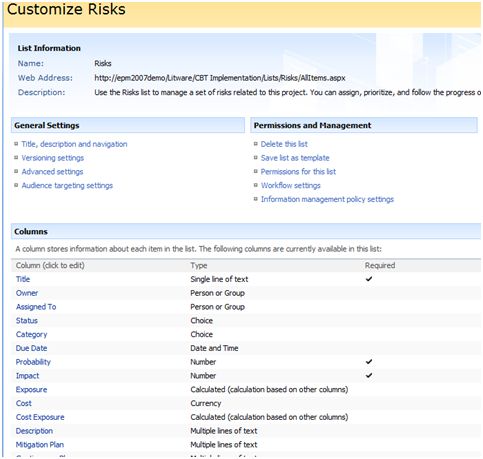
Then use the Column name in the Fields list source by simply prefixing each name with ows_, for example: ows_Title
Resulting in something like this:
Step 6: Finally Create a Test Report to see the Results!
Now add a table to your report and add those columns to preview the data, you should see something like this:
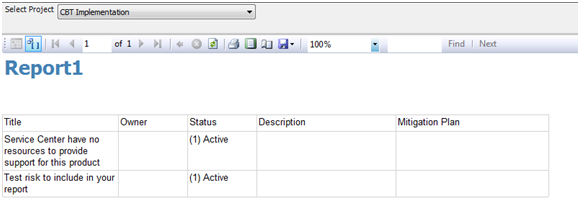
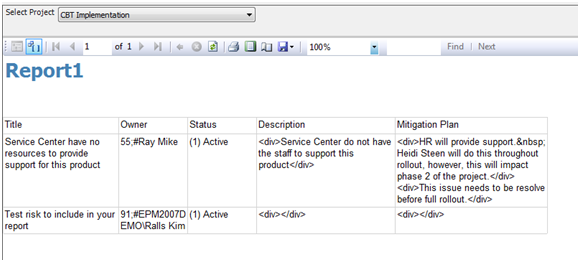
Unfortunately you might notice some fields being blank, there’s actually something we forgot! One of the possible parameters in the dataset above is "viewName", that does exactly what you would think select’s the desired view, so as my example above (using the EPM2007DEMO databases with default column names) Owner, Description and Mitigation Plan are all blank, this is because the Default view configured for that list does not include them.
So you can fix this by changing the default view to include the required fields or by creating your own view and using the viewName parameter. Note though; that parameter requires the GUID of the view not it’s name, so you need to use something like http://meyerweb.com/eric/tools/dencoder/ to decode the GUID from the URL of the view. (See the above linked blog by David Wise for additional details on the parameters available)
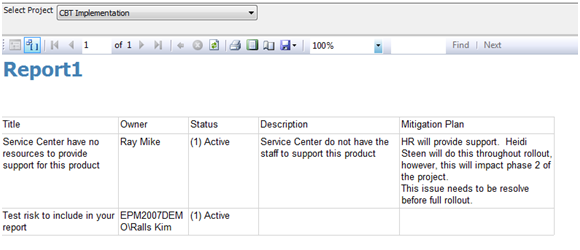
One that is done, you should now see something more like this:
Looking good! (Almost!)
Just one last thing there, you can see the special characters in the data, for the Description and Mitigation Plan it is an easy matter of changing the ‘Placeholder Properties’ to Markup Type: HTML. However for the Owner and as you’ll find various other fields they contain internal codes used by SharePoint, these have to be removed with code, again David’s blog above has some code to do just that, or if you’re like me and didn’t quite bother to read down that far you can create your own and add it to the Report Properties – Code section:
Public Function CleanSPSInput(strIn As String) As String
Dim RegEx as System.Text.RegularExpressions.Regex
‘ Replace invalid characters with empty strings
if strIn = "" OR IsDBNull(strIn)
Return ""
Else
Return Regex.Replace(strIn, ".+;#", "")
End If
End Function
|
Then just replace your Owner field name with the following expression:
| =code.CleanSPSInput(Fields!Owner.Value) |
Now your report should look something like this:
All Done!(Well for me at least)
What’s the catch?
There is actually a big one which you might have guessed: performance.
The above report is effectively generating the report by browsing to each page and pulling down each list item every time the report is generated. For one single project like in the example above, that’s not such an issue, but if you wanted to create a portfolio summary report for example or batch process a single project report for all active projects then performance would quickly become a problem.
Much of that can be addressed through Reporting Services itself, using caching and pre-generation, etc or better yet using SQL Integration Services (SSIS). With that and some much more interesting scripting a DTS job could be created to setup your very own staging database using the same XML methods as above! Definitely something to blog about another time…
But what about??
Yes there are lots of questions left unanswered;
- What if someone renames the list used above?
- What if someone changes / deletes the view I selected?
- What if …
I think you can see some of the limitations here and possible also how they can be overcome (workspace template standards, etc) but I’ll leave that to you.


